Monitoring GitHub Copilot Adoption with Metrics
Published on
Introduction
Since GitHub released the Copilot usage metrics dashboard and API in public preview back in October, I’ve been spending a lot of time helping enterprise administrators understand Copilot’s impact using these metrics.
The conversation has shifted from “are teams using AI?” to “how well are they using it?” and “what is the actual impact?”
The State of Copilot Metrics
GitHub’s native metrics dashboard provides aggregated data at the enterprise level. It shows:
- Daily and weekly active users across GitHub Copilot IDE modes, including agent mode
- Agent adoption across your user base
- Lines of code added and deleted across all IDE modes
- Language and model usage patterns across IDEs
That said, at the time I’m writing this post Copilot Metrics Dashboard is still in Public Preview. The Product Team is actively adding new views. And administrators as well as stakeholders often need deeper insights at the user level to understand adoption patterns, identify champions, and provide targeted support to teams.
Building a Custom Metrics Viewer (with Copilot, of course)
As someone supporting enterprises across EMEA with their Copilot adoption, I often discuss what other insights they may want to extract from the metrics that GitHub provides. So I did what any developer would do — I vibe-coded my own solution using GitHub Copilot itself.
The GitHub Copilot User-Level Metrics Viewer is a client-side web application that takes raw Copilot usage exports and displays data in an easy-to-understand format. You upload your metrics file, and it visualizes user engagement patterns, adoption of various features and models.
The entire application was built end-to-end with GitHub Copilot, from the initial scaffolding to chart implementations and insights blocks. It was a fun experience and shows what’s possible with AI-assisted development.
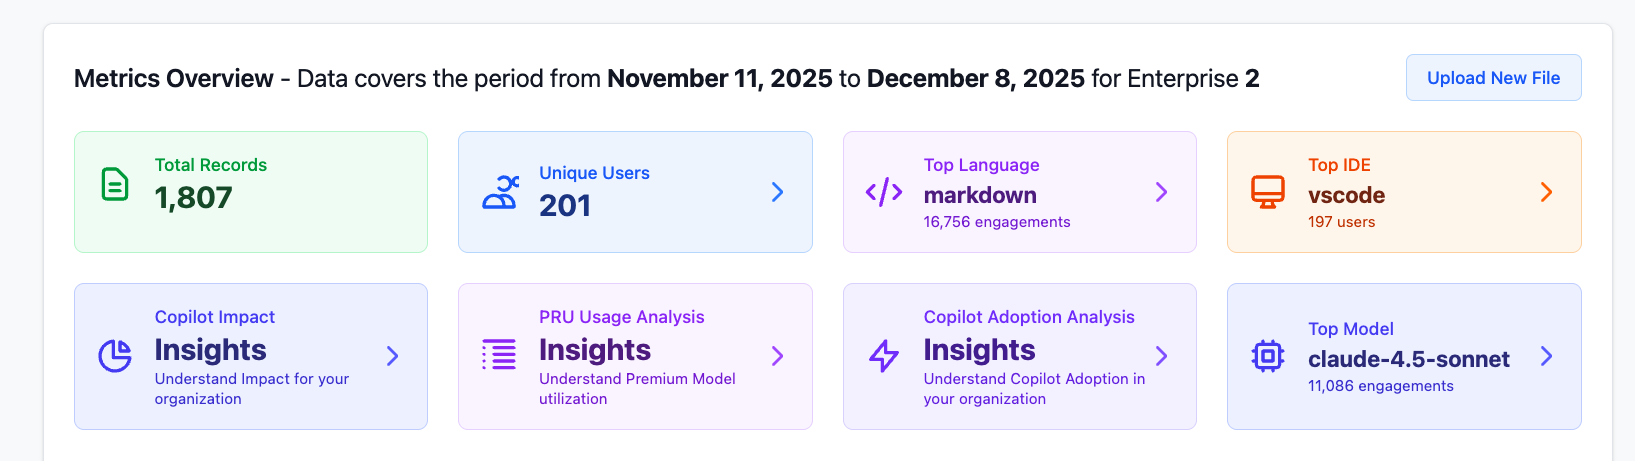
What the Viewer Offers
Engagement & Adoption Analytics
The dashboard gives you an opinionated overview of how your organization is adopting Copilot:
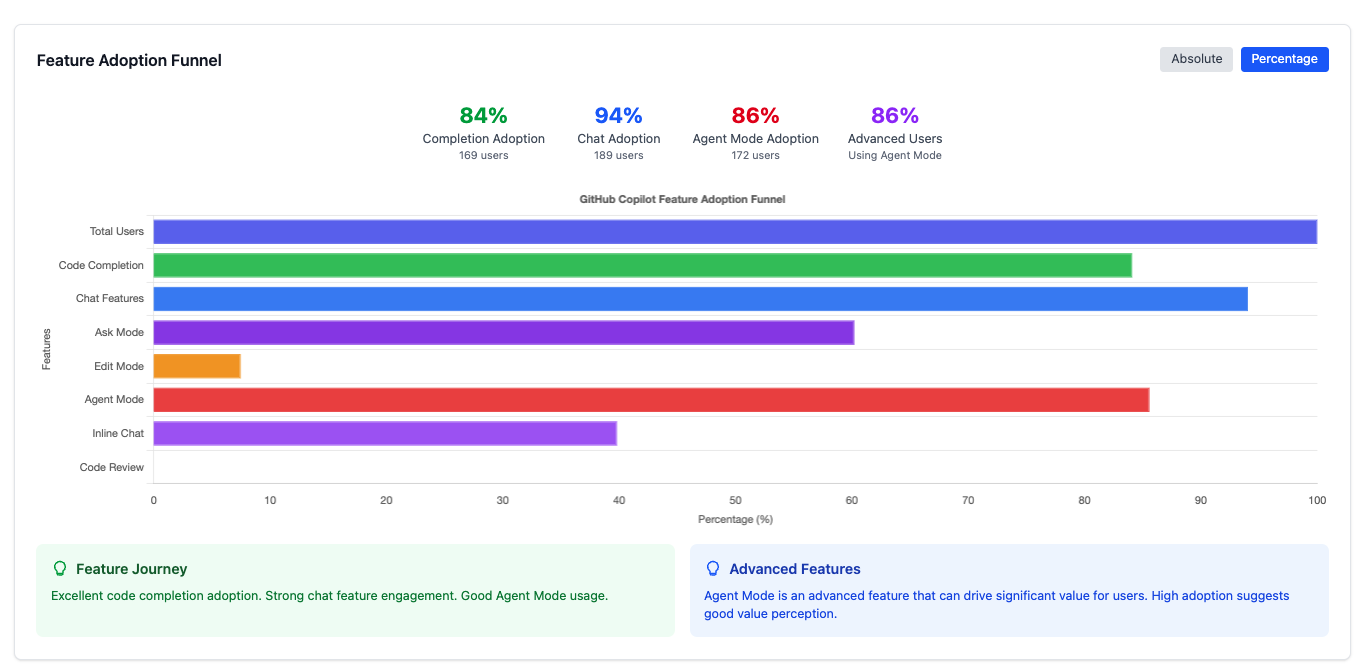
Agent Mode & Chat Insights
Understanding how developers use different Copilot modes is crucial:
- Chat Users by Mode: Separate tracking for Ask mode, Edit mode, Agent mode, and Inline mode.
- Daily Chat Requests: Volume analysis across different interaction types.
- Agent Mode Heatmap: Visualize intensity of agent mode usage across days, including estimated service value calculations.
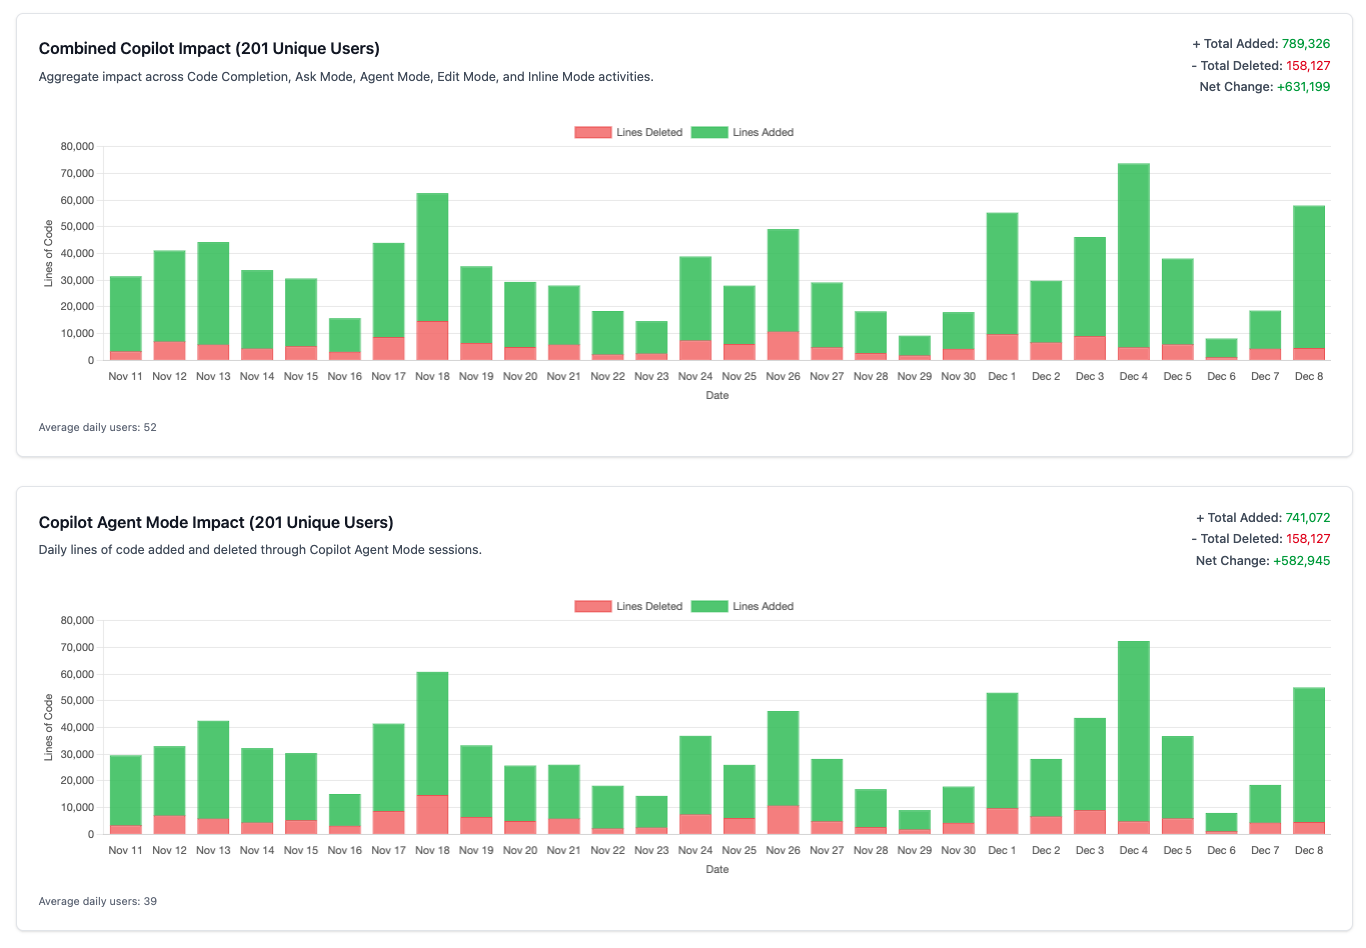
Copilot Impact Analysis
One of the most requested features—measuring actual Copilot impact on your codebase (also was shipped as a native dashboard a few days ago):
- Lines of Code Impact: Track LOC added and deleted through different Copilot features.
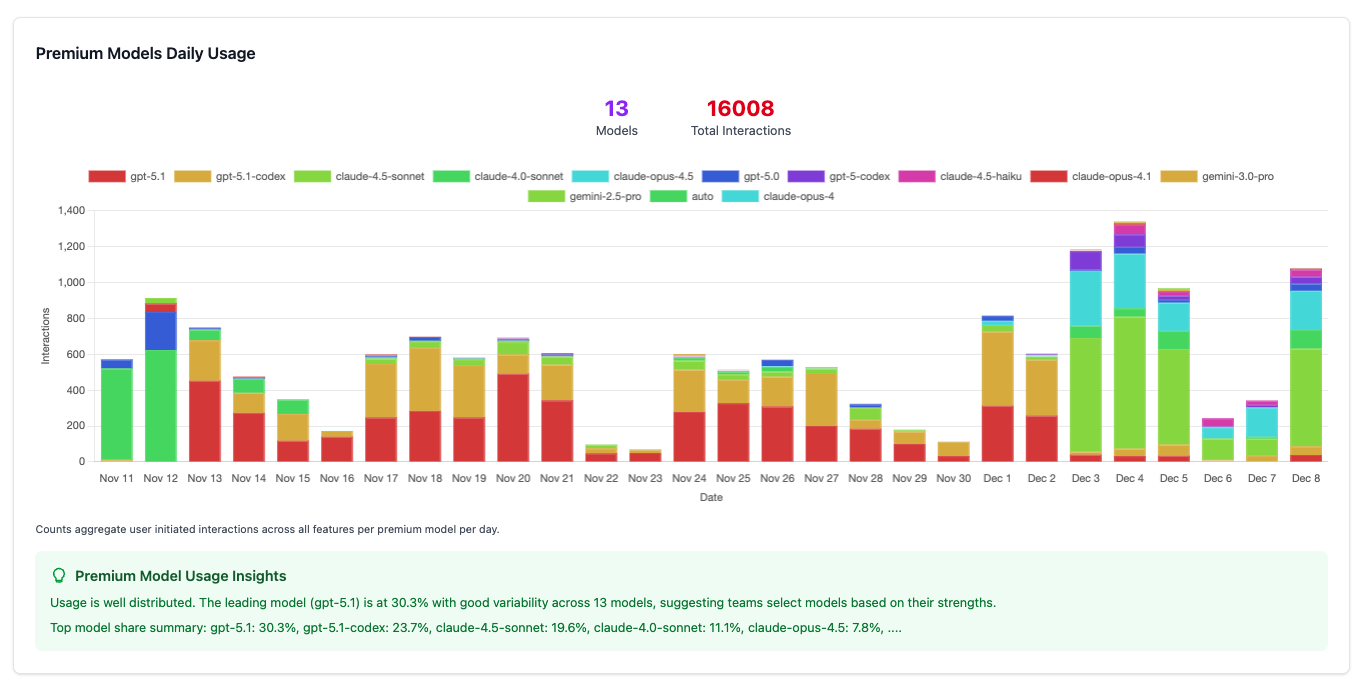
Premium Request Unit (PRU) Analysis
With premium models in Copilot, understanding consumption patterns is essential:
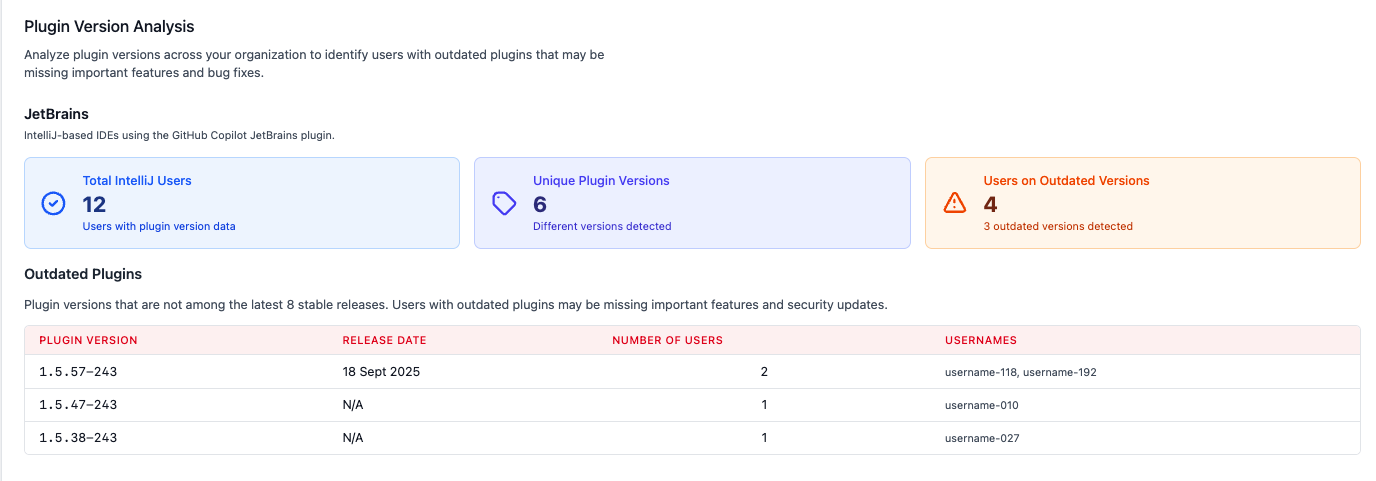
Plugin Version Tracking
The data provided via the API is based on IDE-side telemetry, which may be skewed if developers are using outdated plugins. On top of that, outdated GitHub Copilot plugins may not support the latest features, models and in general provide suboptimal experience.
This project provides an overview of plugin versions in use across your organization and highlights outdated installations.
- JetBrains & VS Code Extension Analysis: Track which plugin versions your developers are using.
- Outdated Plugin Detection: Identify users with outdated extensions that may be missing features or have incomplete telemetry.
- Upgrade Recommendations: Actionable insights to drive plugin updates across your organization.
Individual User Deep Dives
Something that is also not currently available in GitHub’s native dashboard, user level information:
- Per-User Statistics: Interactions, code generation events, acceptance rates, and feature usage.
- Language & IDE Preferences: Understand how individual developers use Copilot across their workflow.
- Premium and Standard Model Usage: Understand which users are leveraging premium models and how often.
These insights help identify power users, potential champions, and those who may need additional support or training.
How It Works
- Export your data: Metrics file (NDJSON format) can be exported from the GitHub portal (under Enterprise Settings > Insights > Copilot Usage > Export).
- Upload to the viewer: Select your metrics file.
- Explore insights: Navigate through Overview, Users, Languages, IDEs, Impact, PRU Usage, and Adoption views.
All processing happens client-side. Your data never leaves your browser, making it safe for enterprise use without additional security reviews.
Beyond the Viewer
This custom viewer is purposely designed as a lightweight solution for quick overview of data snapshot. For long-term analysis, I strongly recommend integrating Copilot metrics into your existing data analytics infrastructure. Tools like Power BI, Looker, Tableau, or similar platforms provide:
- Historical trend analysis
- Integration with other business metrics
- Custom dashboards tailored to your organization
- Advanced data visualization capabilities
- Automated reporting and alerts
The custom viewer can serve as inspiration for the types of metrics and visualizations most relevant to your organization’s needs.
Try It Out
The tool is open source and deployed to GitHub Pages. You can try it at:
https://asizikov-demos.github.io/copilot-user-level-statistics-viewer/
Simply upload your metrics file and start exploring. The source code is available on GitHub. All data processing happens client-side, nothing leaves your browser, however for enterprise use please ensure compliance with your organization’s data policies. You may also clone the repo and host it internally if needed.
Conclusion
Whether you use this custom viewer, build your own solution, or integrate directly with enterprise analytics platforms, the key is to move beyond basic adoption numbers and understand how your teams are using Copilot to transform their development workflows.
I hope this tool helps you get started on that journey and gives you a clearer picture of your organization’s Copilot usage!
I’m employed by GitHub at the time of writing this post. All opinions are my own.